iotill
Log in
EN
English Français
Demo?
Menu

IOTILL ANALYTICS / SALES ANALYSIS

Understand your figures.
Make informed decisions.

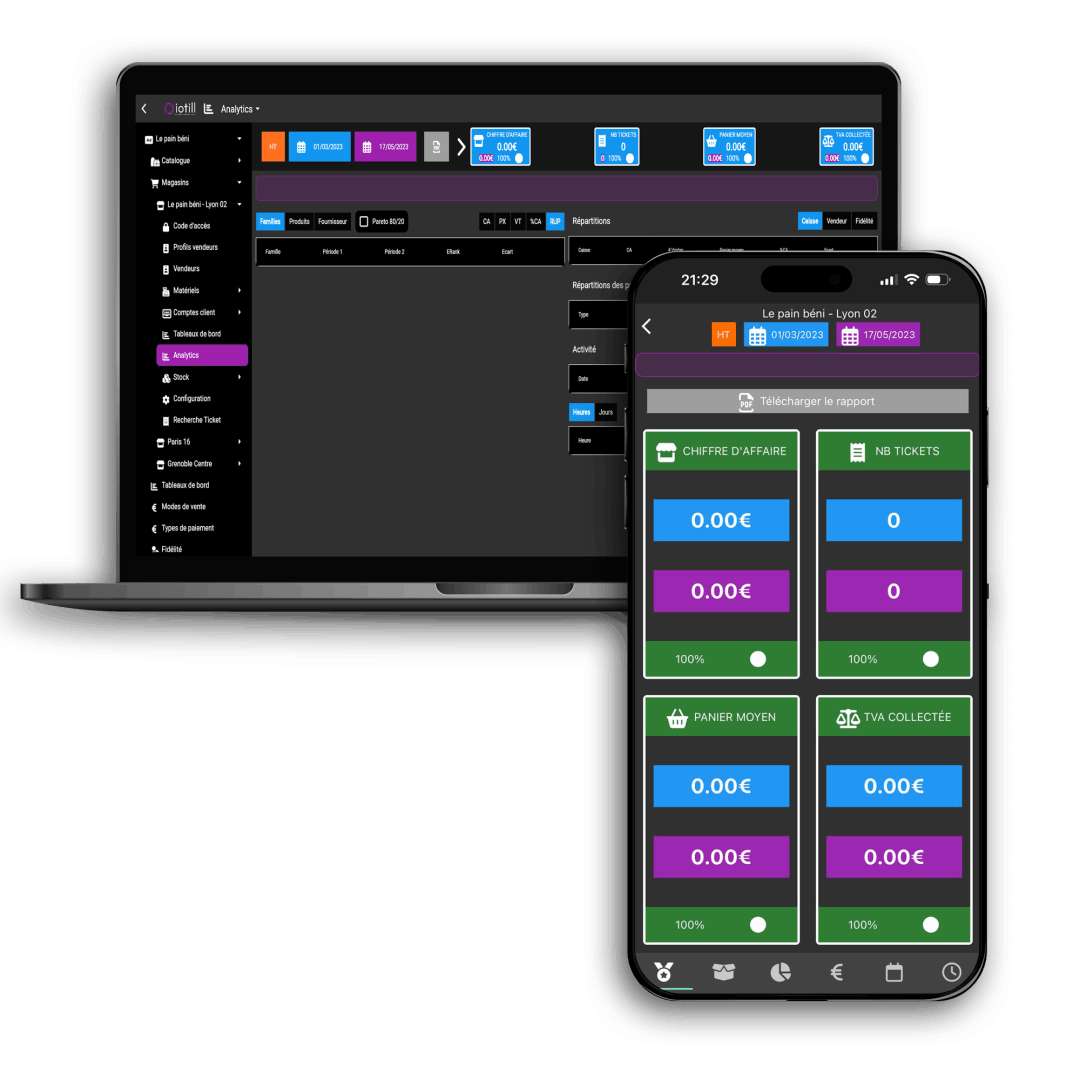
Compare periods. Identify your busiest hours. See what sells, by product and category. iotill Analytics helps you understand your business in greater detail.

Request an Analytics demo
iotill analytics interface on desktop and smartphone

FROM FIGURES TO USEFUL QUESTIONS

A period.

How does business change from one period to the next? Compare sales to inform your next decisions.

An hour.

When do most sales happen? Understand your business’s rhythm to plan service.

A product.

Which products and categories drive sales? Look beyond the overall total.

ONE BUSINESS OR AN ENTIRE NETWORK

Management and analysis.
Working together.

iotill Cloud centralises sales, stock and location management. iotill Analytics helps you analyse the figures. For a franchise, plan how head office and local teams will use the tools with your iotill contact.

LET’S PLAN THE NEXT STEP TOGETHER.

Let’s talk.

Let’s start with the questions you have about your business.

Request a demo

USEFUL ANSWERS

Before you
get started.

Plan my equipment ↗
What analysis does iotill Analytics offer?
iotill Analytics compares periods and examines sales by hour, product and category to help you understand your business.
Can Analytics support a multi-site project?
Yes. iotill Analytics supports network management alongside iotill Cloud. A demonstration helps prepare useful views for head office and location managers.